Raytracing optics:
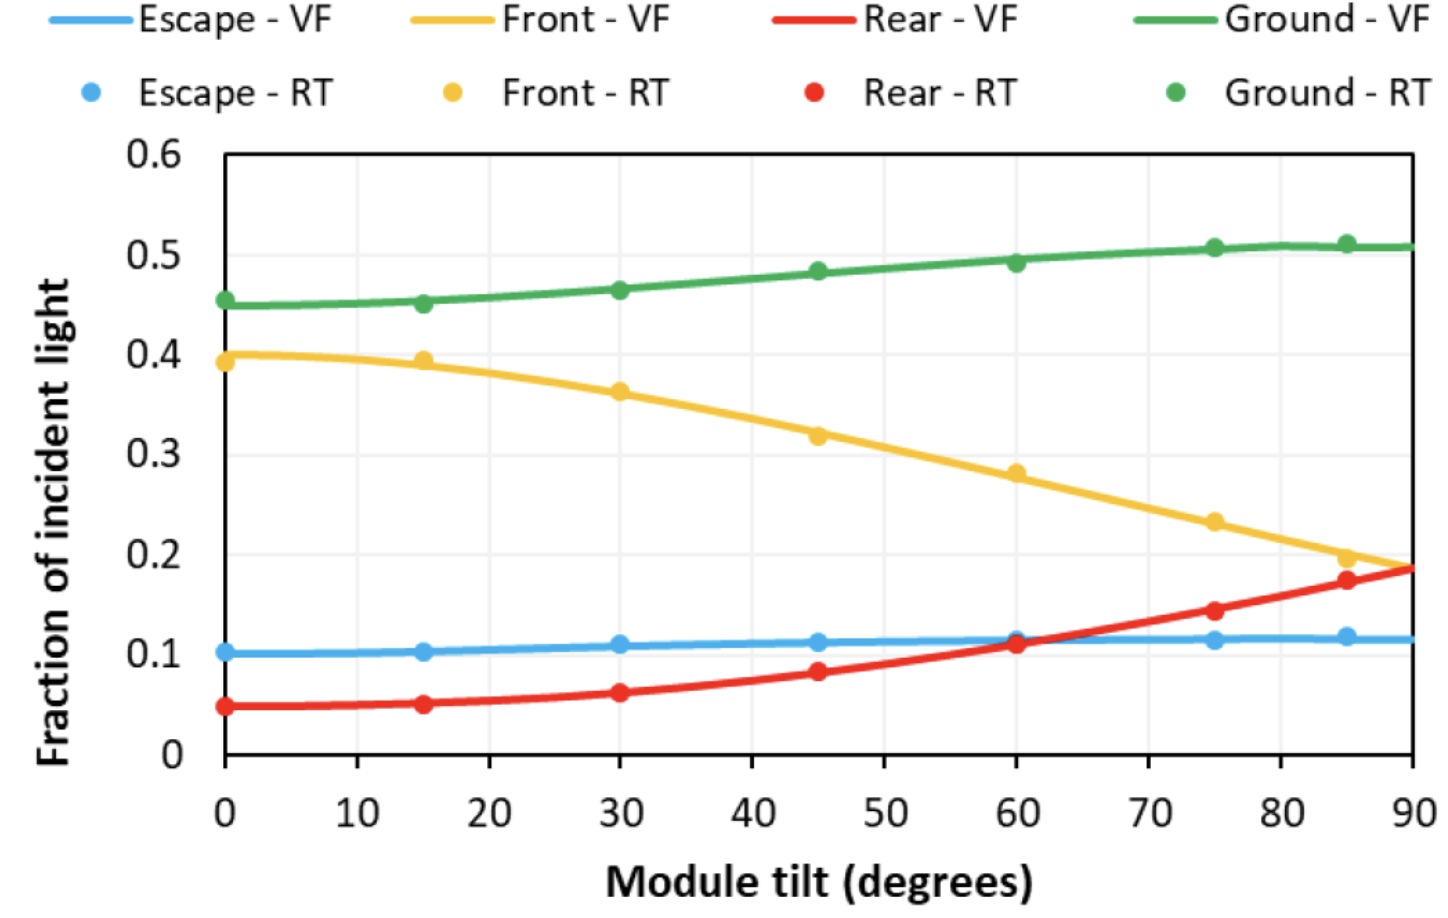
SunSolve Yield and view factor give identical results for ideal scenarios
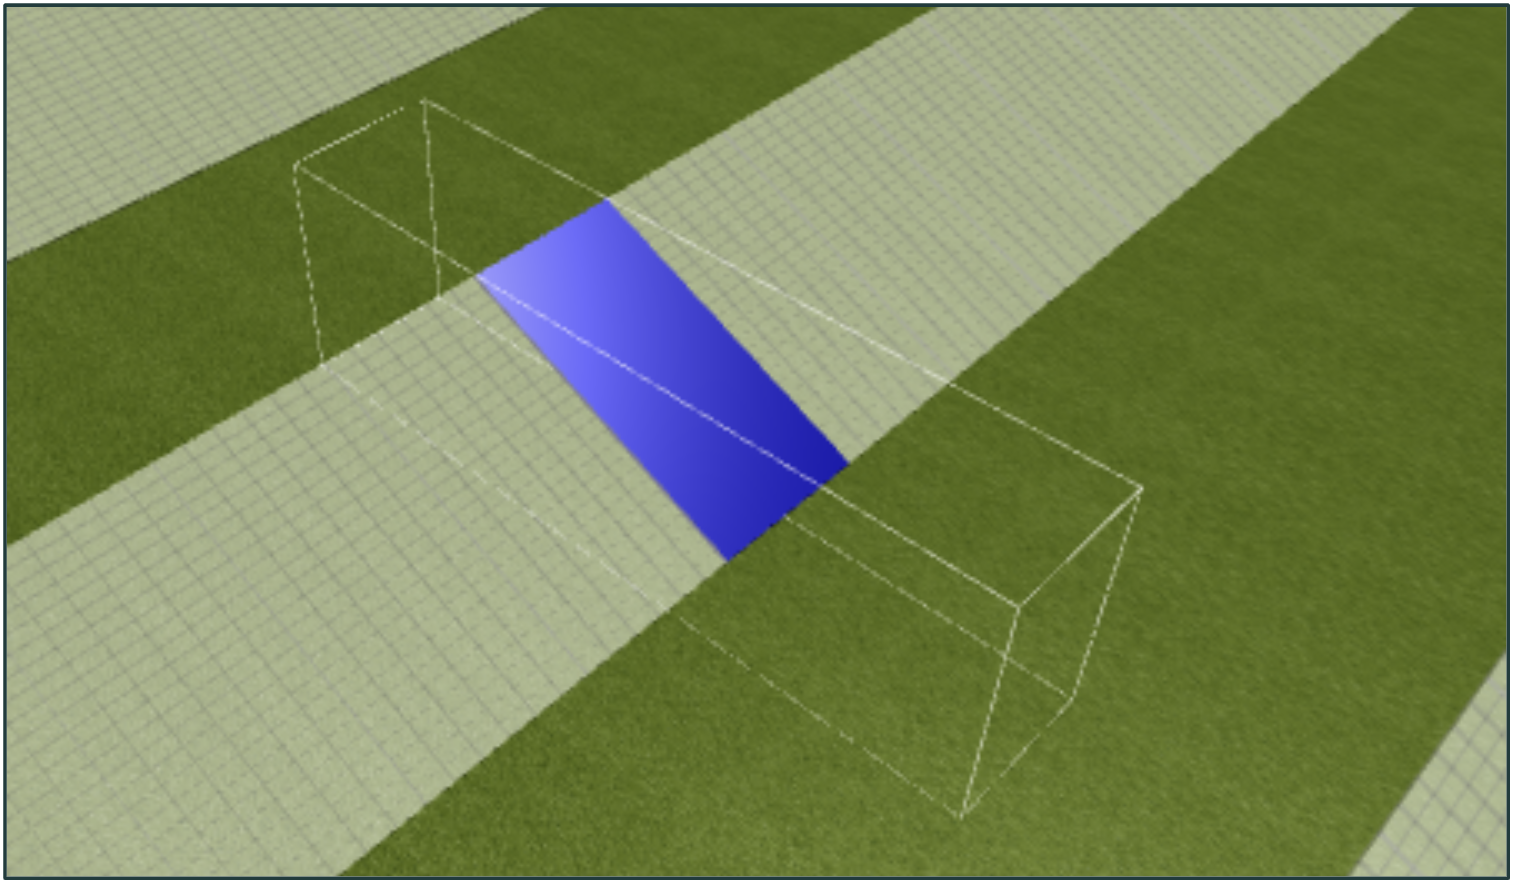
A basic test for a ray tracing engine is whether it accurately simulates an ideal scenario. The results of one of those tests is shown below. This test represents the case of a central bifacial module in an infinite field when there are no structural supports, no gaps between modules, and an isotropic light source. In this simple case, the view-factor method can be used to calculate the exact irradiance on the front and rear of the module, providing results with which to test the ray tracing.
Very close agreement between simulation and experiment for bifacial modules
In a collaborative study, FTC Solar and PV Lighthouse found that SunSolve Yield accurately represented the optics of a solar tracker [2, 3]. The graphs below plot the irradiance at the front and rear of a bifacial 1P tracking system on a sunny day. The blue symbols plot measurements from pyranometers installed at the axis of the torque tube and in the plane of array, and the orange symbols plot the irradiance calculated at the same location by ray tracing.
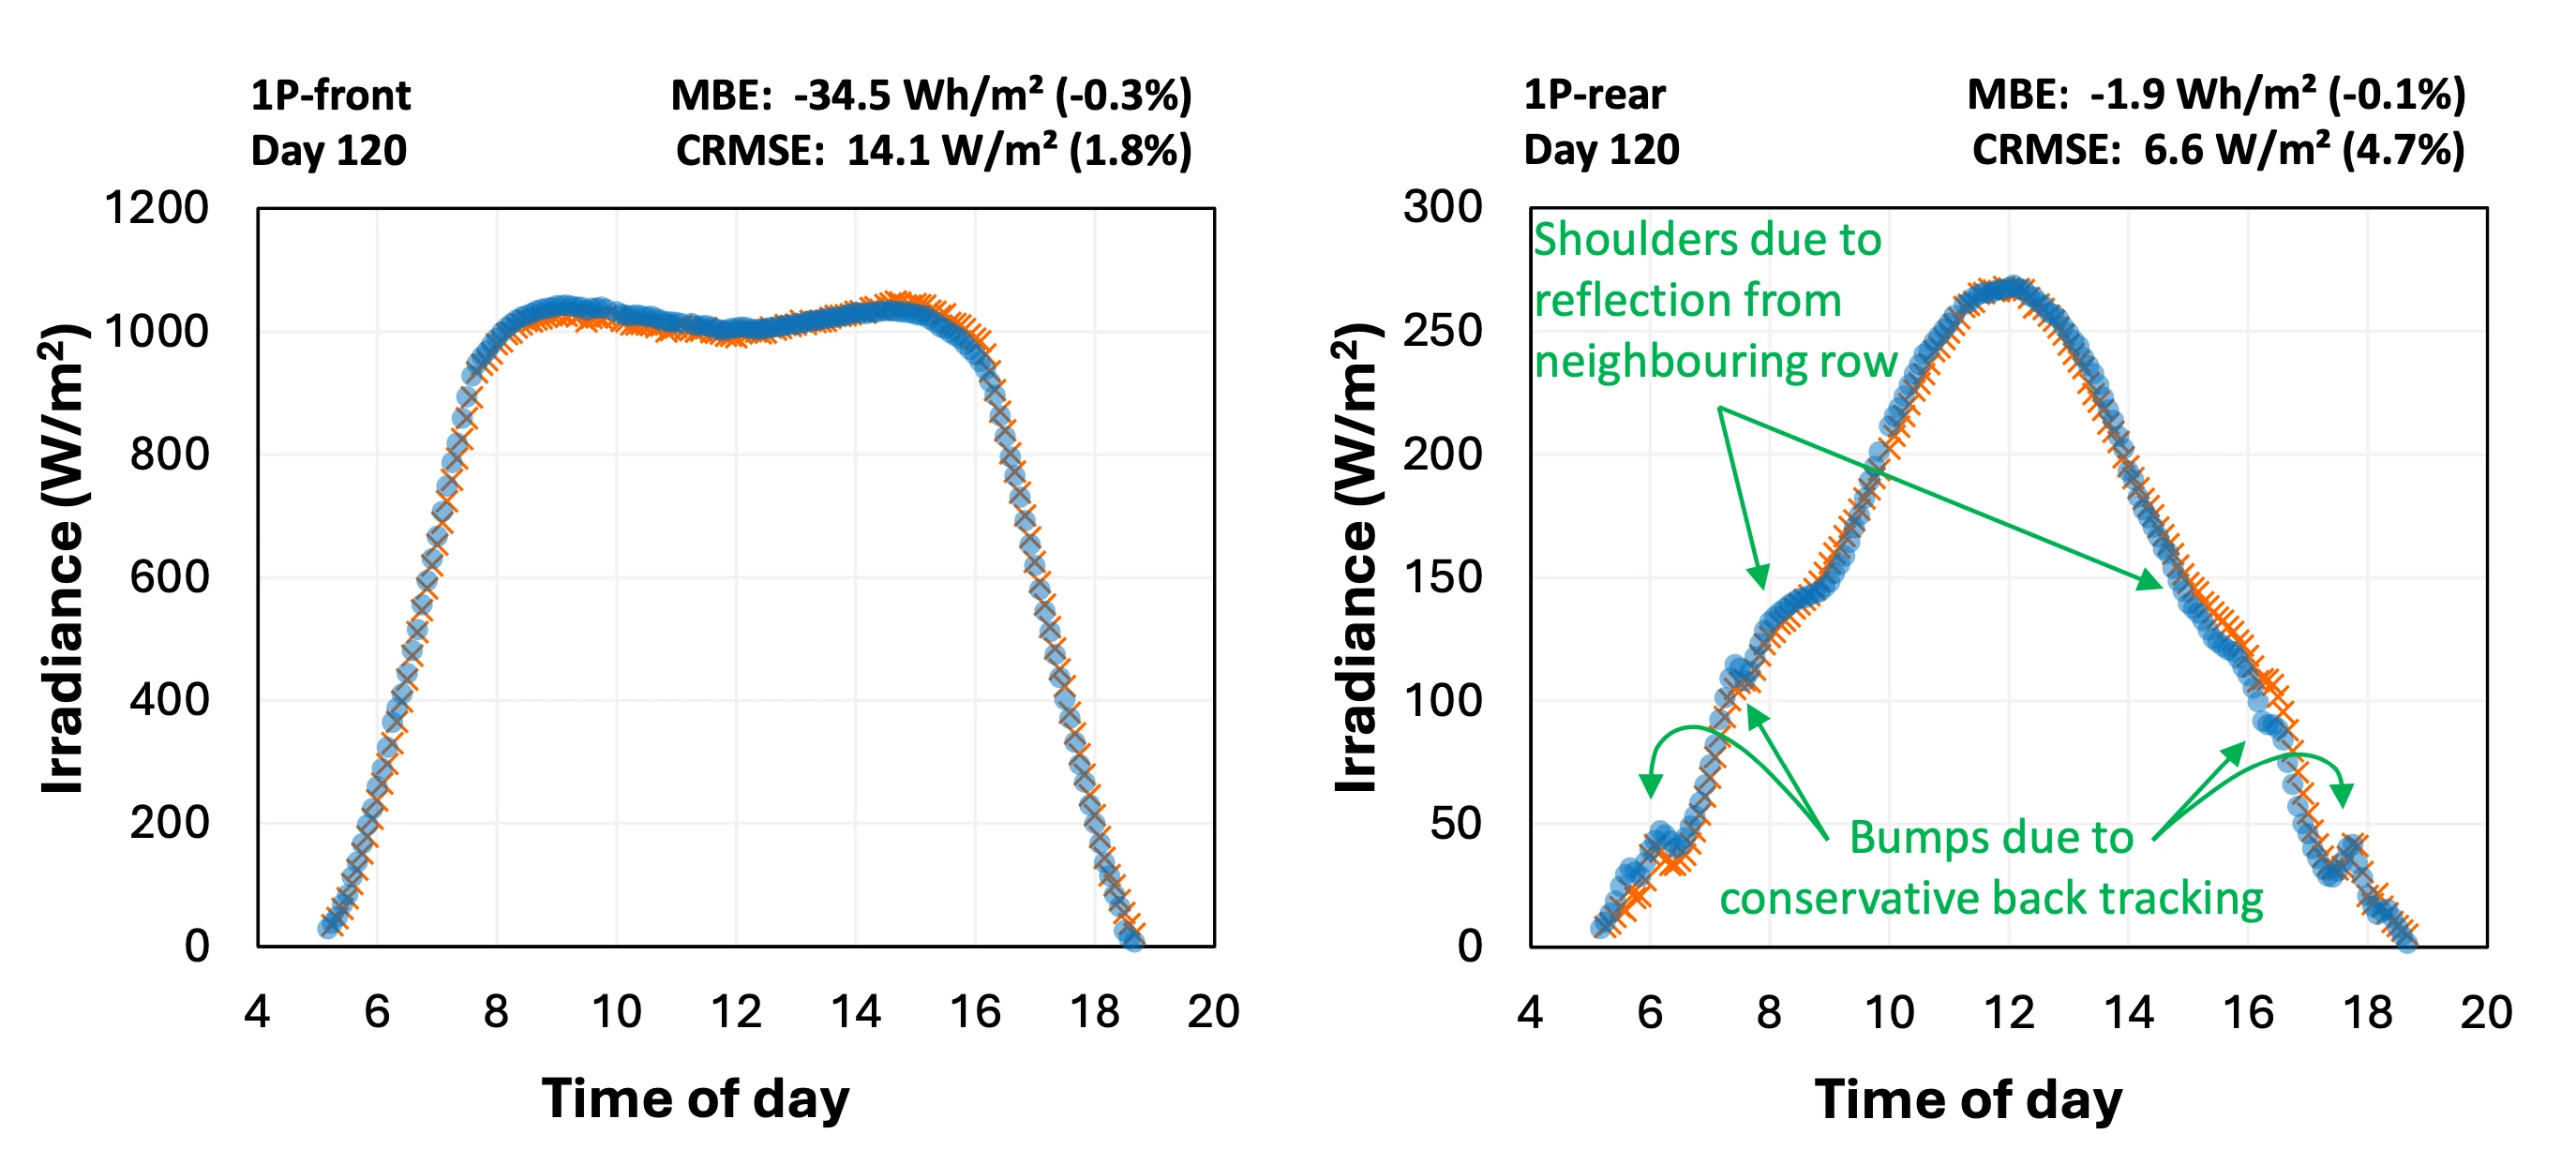
As demonstrated by the graphs (and by the low MBE and CRMSE), there was very close agreement between simulation and experiment. In addition to predicting the general rise and fall of the irradiance, the ray tracing matched second-order effects caused by two complications: (i) a conservative backtracking algorithm that allowed light to fall between rows early and late in the day, and (ii) light reflecting from the front side of neighbouring modules onto the rear POA detector.
Ray tracing framework validated by over a hundred academic papers
SunSolve Yield uses an optical raytracing framework that was first created by PV Lighthouse in 2015. Since then, it has been tested by many researchers at the leading PV companies and institutes. Combined, they have published over 100 academic papers that apply and validate their SunSolve simulations of PV cells, modules and systems.
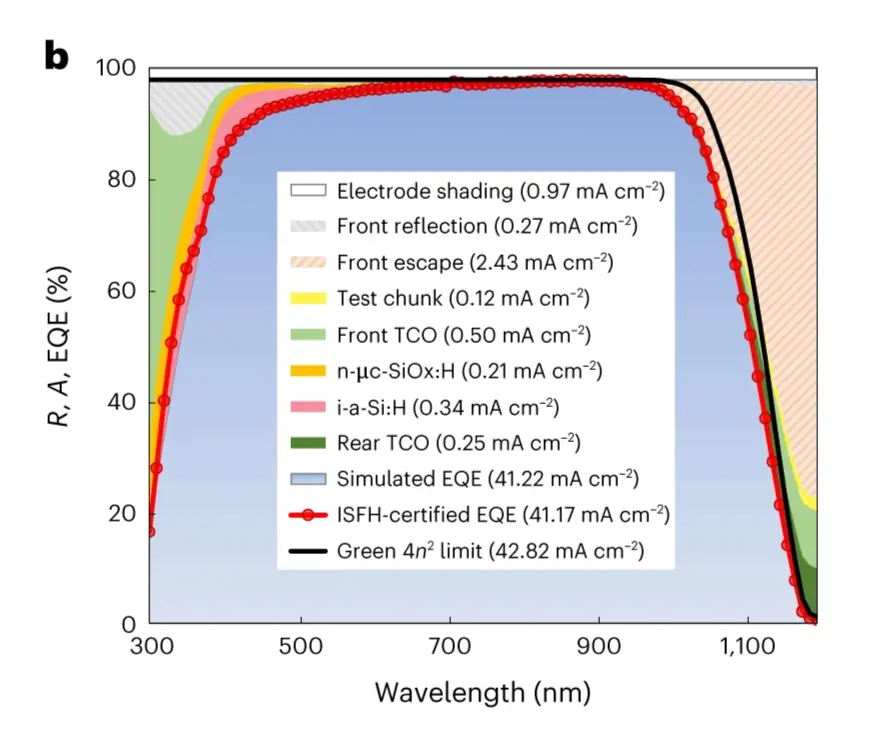
For example, LONGi compared simulations and measurements of their world-record solar cell published in Nature Energy [1]. As evident in the figure below, they demonstrated that their simulated EQE (edge of blue area) agreed with their measurements (red symbols) at all wavelengths. This gave them high confidence in their SunSolve loss analysis.
Bifacial factors:
SunSolve Yield is frequently used by developers to determine the bifacial factors required as inputs for PVSyst and other yield programs like Solar Farmer, Plant Predict and SAM.
The approach to determine those factors was evaluated in a collaborative study between Array Technologies, CFV Solar and PV Lighthouse [4, 5]. In this work, SunSolve simulations were first validated against an Array Technologies single-axis tracker at CFV Solar’s test facility, and then used to determine the bifacial inputs specific to Array’s tracker. After inserting the bifacial factors determine by SunSolve into PVSyst, Array Technologies concluded that they could match the net energy produced by two bifacial systems over a 16-day test period to within ±0.3%.
Thermal models:
SunSolve Yield contains the option to include advanced thermal models that extend the standard Faiman model used in most software. These models were evaluated in separate collaborative studies with FTC Solar and 5B. The advanced models were found to reduce the error in the simulated module temperature by a factor of 2 or 3.
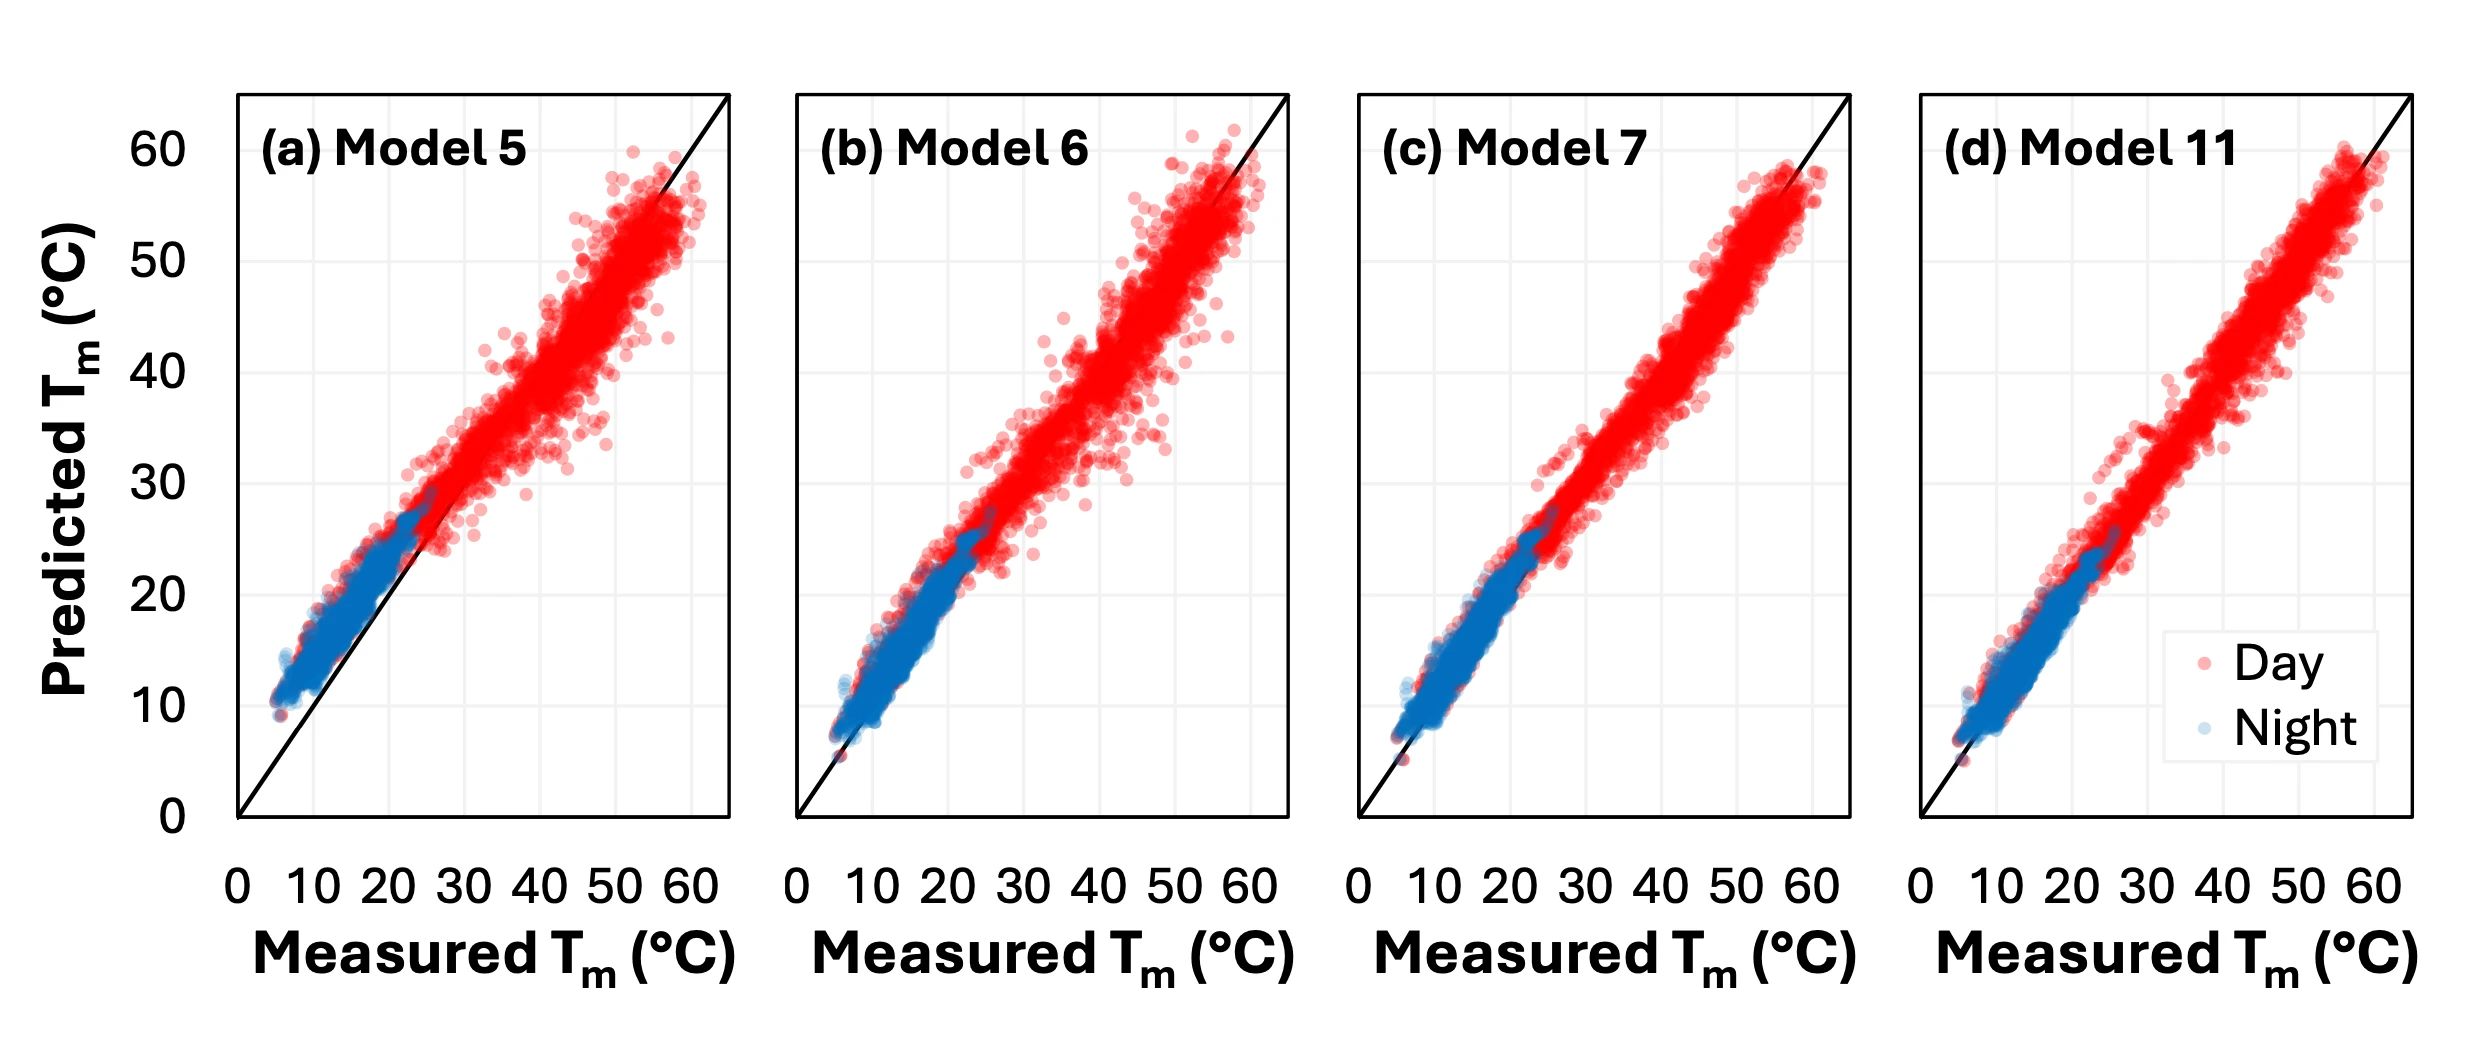
For example, the figure below plots the predicted and measured module temperature Tm from a study with FTC Solar on single-axis trackers [3]. The results for Model 5 illustrate the best fit that can be achieved with the standard Faiman model; it amounts to an uncertainty in the predicted Tm of ±6.6 ºC. The various advanced thermal models greatly reduce that uncertainty; the uncertainty in Tm of the most advanced model was just ±2.8 ºC. (The quoted error represents the 95% confidence interval.)
Differences with PVSyst and other conventional yield models:
A yield forecast contains many interrelated models. There are models for the solar spectrum, for the transposition of light from the sky to the module, and for the electrical and thermal behaviour of the cells and modules.
We find that SunSolve Yield provides identical results to PVSyst for ideal conditions, such as for the central monofacial module in an infinite field with no shading or mismatch. This indicates that the ray tracing and view-factor models are consistent for ideal conditions. But as a scenario becomes increasingly more complex—such as with bifacial modules, or with shading and reflections from structural supports, or with spacing between modules—the results from SunSolve Yield increasingly diverge from PVSyst.
We explain and quantify the sources of difference in this presentation [2].
References
- Lin, H., Yang, M., Ru, X. et al. Silicon heterojunction solar cells with up to 26.81% efficiency achieved by electrically optimized nanocrystalline-silicon hole contact layers. Nat Energy 8, 789-799 (2023). https://doi.org/10.1038/s41560-023-01255-2
- McIntosh, K.R., Abbott, M.D., Sudbury, B.A, “Differences between advanced and conventional models in bifacial yield simulations,” PVPMC workshop, Salt Lake City, 2023. https://www.sunsolve.info/videos/pvpmc_workshop_2023/
- McIntosh, K.R., Abbott, M.D., Sudbury, B.A., Aneja, S., Bowman, M., Brown, L., Kahane, B., Nicholas, N. and Nolde, K., 2022, June. The influence of wind and module tilt on the operating temperature of single-axis trackers. In 2022 IEEE 49th Photovoltaics Specialists Conference (PVSC) (pp. 1033-1036). IEEE. https://downloads.pvlighthouse.com.au/papers/McIntosh2022-SAT-thermal-study.pdf
- Crimmins, J., McIntosh, K.R., Creasy, L., Lee, K. “Field testing meets modelling: validated data on bifacial solar performance,” White Paper, CFV Solar, PV Lighthouse, Array Technologies. https://arraytechinc.com/resources/white-papers/field-testing-meets-modeling-2/
- Passow, K., Lee, K., Creasy, L., Sharp, J., Nagyvary, J., McIntosh, K.R., Abbott, M.D., Sudbury, B.A., Crimmins, J. and Zirzow, D., 2020, June. Estimating bifacial loss factors for annual utility scale simulations. In 2020 47th IEEE Photovoltaic Specialists Conference (PVSC) (pp. 2348-2349). IEEE.